Market Outlook
October 13, 2016
Market Cues
Domestic Indices
Chg (%)
(Pts)
(Close)
Indian markets are likely to open flat with a negative bias tracking global markets
BSE Sensex
0.1
21
28,082
and SGX NIFTY. After two trading holidays investors and traders will look forward
Nifty
0.1
11
8,709
for key results during the quarter.
Mid Cap
(0.2)
(28)
13,515
Small Cap
0.3
34
13,256
The US markets remained lackluster throughout the day on Wednesday, as traders
avoided taking significant positions ahead of the release of the minutes of the latest
Bankex
(0.1)
(30)
22,123
Federal Reserve’s meeting.
Global Indices
Chg (%)
(Pts)
(Close)
The European markets closed on a mixed note and remained under pressure amid
cautious move by investors by traders and investors as they waited the details of the
Dow Jones
0.1
16
18,144
meeting of US Fed.
Nasdaq
(0.1)
(8)
5,239
Indian markets remained lackluster on Monday ahead of festive holidays. While
FTSE
(0.7)
(47)
7,024
global events will be key to watch, the Indian markets will be more concerned about
Nikkei
(0.4)
(68)
16,772
key development in the domestic fronts as well as commentary by Tech majors like
Hang Seng
(1.4)
(336)
23,071
TCS and Infosys which are likely to report results during the week.
Shanghai Com
(0.1)
(2)
3,057
News Analysis
Advances / Declines
BSE
NSE
Result preview: TCS
IndusInd Bank reports 26% growth in PAT at `704cr
Advances
1,702
944
Detailed analysis on Pg2
Declines
1,204
680
Unchanged
128
80
Investor’s Ready Reckoner
Key Domestic & Global Indicators
Volumes (` Cr)
Stock Watch: Latest investment recommendations on 150+ stocks
BSE
2,502
Refer Pg6 onwards
NSE
15,092
Top Picks
CMP
Target
Upside
Company
Sector
Rating
Net Inflows (` Cr)
Net
Mtd
Ytd
(`)
(`)
(%)
Amara Raja Batteries Auto & Auto Ancill. Accumulate
1,053
1,174
11.5
FII
65
1,694
51,698
HCL Tech
IT
Buy
813
1,000
23.0
MFs
603
603
14,550
Bharat Electronics
Capital Goods
Accumulate
1,254
1,414
12.8
Equitas Holdings
Financials
Buy
178
235
32.3
Top Gainers
Price (`)
Chg (%)
Navkar Corporation Others
Buy
194
265
36.4
Aban
253
13.5
More Top Picks on Pg4
Pcjeweller
520
7.3
Key Upcoming Events
Nationalum
52
6.7
Previous
Consensus
Date
Region
Event Description
Reading
Expectations
Raymond
590
6.3
Oct 13 India
Imports YoY%
(14.1)
--
Tatacomm
647
5.9
Oct 13 India
Exports YoY%
(0.3)
--
Oct 13 China
Exports YoY%
(2.8)
(3.3)
Top Losers
Price (`)
Chg (%)
Oct 13 US
Initial Jobless claims
249.0
--
Repcohome
778
(5.6)
Oct 14 US
Producer Price Index (MoM)
(0.3)
--
Oct 14 India
Monthly Wholesale Prices YoY%
3.7
3.9
Prestige
203
(3.6)
Oct 14 China
Consumer Price Index (YoY)
1.3
1.6
Jppower
5
(3.4)
6.(
More Events on Pg5
Bajajhldng
1,998
(3.1)
Coromandel
262
(3.0)
As on October 10, 2016
Market Outlook
October 13, 2016
News Analysis
Result Preview:
TCS (CMP: `2,380 / TP: `3,004 /Upside: 26.2%)
TCS is slated to announce its 2QFY2017 results today. We expect the company to
post 1.8% sequential growth in USD revenues to US$4,441mn. In rupee terms,
revenues are expected to come in at `29,707cr, up 1.4% qoq. EBIT margin is
expected to show an expansion of ~11bp qoq to end the period at 25.2% on
account of strong growth. Consequently, PAT is expected to be at `6,377cr, a rise
of 0.9% qoq. We maintain our buy rating on the stock with a target price of
`3,004.
Y/E
Sales OPM
PAT
EPS ROE P/E P/BV EV/EBITDA EV/Sales
March
(` cr)
(%)
(` cr)
(`)
(%)
(x)
(x)
(x)
(x)
FY2017E
1,21,684
27.3
26,432
135.0
33.2
17.6
5.9
13.2
3.6
FY2018E
1,36,286
27.3
29,369
150.1
33.9
15.9
5.4
11.5
3.2
IndusInd Bank reports 26% growth in PAT:
IndusInd Bank reported a steady set of results for the quarter with PAT growing by
26% YoY to `704cr, compared to `560cr during the same period last year. NII
during the quarter grew by 33.5% to `1,460cr. Other income also grew by a
healthy 23.9% to Rs 970 cr compared to `783cr during the same period last year.
The banks NIM improved to 4% from 3.88% YoY.
Asset quality remained stable for yet another quarter with GNPAs at 0.90% vs
0.91% QoQ, while Net NPAs also remained stable at 0.37% vs 0.38%. In Absolute
terms GNPAs went up by only 4% to `899cr, while NNPAs stood at `369cr up by
only 3.9%. However, during the quarter the provisions were up at `214cr
compared to `158cr.
Economic and Political News
MoUD to clear `25,000cr urban renewal projects
Over 120 Singapore businesses to attend Vibrant Gujarat Summit
Mahanadi basin may emerge as a hydrocarbon hub, says Dharmendra
Pradhan
Corporate News
IL&FS Engineering bags 162 cr order from GAIL.
Bharti Airte’s debt to rise by $ 2 Bn on spectrum buys, says Moody’s
Market Outlook
October 13, 2016
Quarterly Bloomberg Brokers Consensus Estimate
Tata Consultancy Services Ltd Consol - October 13, 2016
Particulars ( ` cr)
2QFY17E
2QFY16
y-o-y (%)
1QFY17 q-o-q (%)
Net sales
29,279
27,165
7.8
29,305
(0.1)
EBITDA
7,717
7,822
(1.4)
7,838
(1.6)
EBITDA margin (%)
26.4
28.8
26.7
Net profit
6,056
6,085
(0.5)
6,317
(4.1)
Infosys Ltd Consol - October 14, 2016
Particulars ( ` cr)
2QFY17E
2QFY16
y-o-y (%)
1QFY17 q-o-q (%)
Net sales
17,049
15,635
9.0
16,782
1.6
EBITDA
4,457
4,351
2.4
4,447
0.2
EBITDA margin (%)
26.1
27.8
26.5
Net profit
3,429
3,398
0.9
3,436
(0.2)
Market Outlook
October 13, 2016
Top Picks ★★★★★
Large Cap
Market Cap
CMP
Target
Upside
Company
Rationale
(` Cr)
(`)
(`)
(%)
To outpace battery industry growth due to better technological
Amara Raja Batteries
17,993
1,053
1,174
11.5
products leading to market share gains in both the
automotive OEM and replacement segments.
Uptick in defense capex by government when coupled with
Bharat Electronics
30,096
1,254
1,414
12.8
BELs strong market positioning, indicate that good times are
ahead for BEL.
The stock is trading at attractive valuations and is factoring all
HCL Tech
1,14,709
813
1,000
23.0
the bad news.
Back on the growth trend, expect a long term growth of 14%
Infosys
2,36,482
1,030
1,370
33.1
to be a US$20bn in FY2020.
Source: Company, Angel Research
Mid Cap
Market Cap
CMP
Target
Upside
Company
Rationale
(` Cr)
(`)
(`)
(%)
Among the top 4 players in the consumer durables segment.
Bajaj Electricals
2,640
261
306
17.2
Improved profitability backed by turn around in E&P
segment. Strong order book lends earnings visibility.
With a focus on the low and medium income (LMI) consumer
Dewan Housing Finance
8,538
293
325
11.1
segment, the company has increased its presence in tier-II &
III cities where the growth opportunity is immense.
Strong loan growth backed by diversified loan portfolio and
adequate CAR. ROE & ROA likely to remain decent as risk of
Equitas Holdings
5,958
178
235
32.3
dilution remains low. Attractive valuations considering
growth.
Economic recovery to have favourable impact on advertising
& circulation revenue growth. Further, the acquisition of a
Jagran Prakashan
6,592
202
225
11.6
radio business (Radio City) would also boost the company's
revenue growth.
Speedier execution and speedier sales, strong revenue
Mahindra Lifespace
1,807
440
522
18.5
visibilty in short-to-long run, attractive valuations
Massive capacity expansion along with rail advantage at ICD
Navkar Corporation
2,770
194
265
36.4
as well CFS augurs well for the company
Market leadership in Hindi news genre and no. 2 viewership
ranking in English news genre, exit from the radio business,
TV Today Network
1,976
331
363
9.6
and anticipated growth in ad spends by corporates to benefit
the stock.
Source: Company, Angel Research
Market Outlook
October 13, 2016
Key Upcoming Events
Result Calendar
Date
Company
October 13, 2016 TCS, Infotech Enterprises
October 14, 2016 Infosys
October 17, 2016 UltraTech Cement
October 19, 2016 KPIT Cummins
October 20, 2016 LIC Housing Fin.
October 21, 2016 ACC, Wipro, MindTree, Cairn India, Kirloskar Engines India Ltd
Source: Bloomberg, Angel Research
Global economic events release calendar
Bloomberg Data
Date
Time
Country Event Description
Unit
Period
Last Reported Estimated
Oct 13, 2016
6:00 PM US Initial Jobless claims
Thousands
Oct 8
249.00
253.00
India Exports YoY%
% Change
Sep
(0.30)
India Imports YoY%
% Change
Sep
(14.09)
China Exports YoY%
% Change
Sep
(2.80)
(3.30)
Oct 14, 2016
7:00 AM China Consumer Price Index (YoY)
% Change
Sep
1.30
1.60
US Producer Price Index (mom)
% Change
Sep
(0.30)
12:00 PM India Monthly Wholesale Prices YoY%
% Change
Sep
3.74
3.90
Oct 17, 2016
2:30 PM Euro Zone Euro-Zone CPI (YoY)
%
Sep F
0.40
6:45 PM US Industrial Production
%
Sep
(0.43)
0.15
Oct 18, 2016
6:00 PM US Consumer price index (mom)
% Change
Sep
0.20
0.30
2:00 PM UK CPI (YoY)
% Change
Sep
0.60
Oct 19, 2016
6:00 PM US Housing Starts
Thousands
Sep
1,142.00
1,170.00
6:00 PM US Building permits
Thousands
Sep
1,152.00
1,165.00
2:00 PM UK Jobless claims change
% Change
Sep
2.40
7:30 AM China Industrial Production (YoY)
% Change
Sep
6.30
6.40
7:30 AM China Real GDP (YoY)
% Change
3Q
6.70
6.70
Oct 20, 2016
5:15 PM Euro Zone ECB announces interest rates
%
Oct 20
-
7:30 PM US Existing home sales
Million
Sep
5.33
5.32
Source: Bloomberg, Angel Research
Market Outlook
October 13, 2016
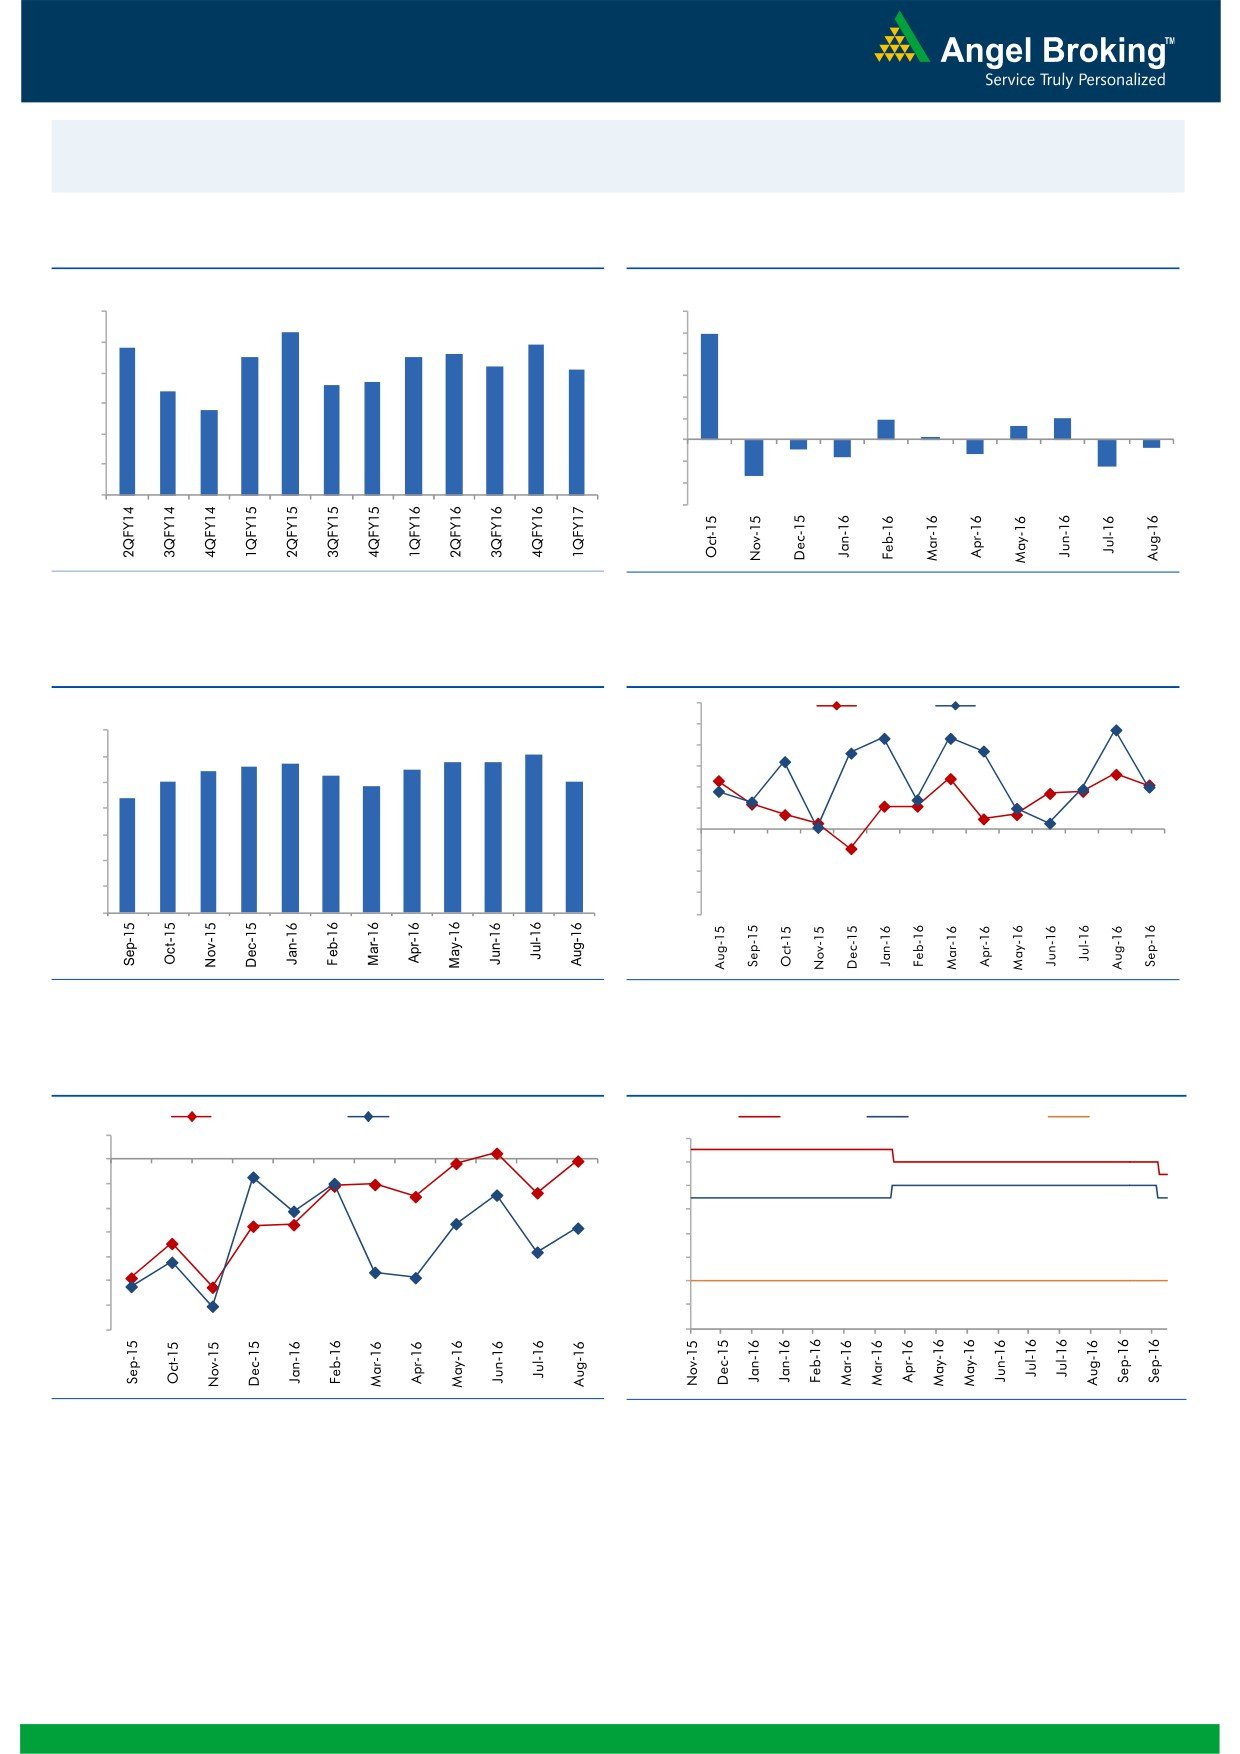
Macro watch
Exhibit 1: Quarterly GDP trends
Exhibit 2: IIP trends
(%)
(%)
9.0
12.0
8.3
9.9
7.8
7.9
10.0
8.0
7.5
7.5
7.6
7.2
7.1
8.0
6.6
6.7
7.0
6.4
6.0
5.8
6.0
4.0
1.9
2.0
1.3
2.0
0.3
5.0
-
4.0
(2.0)
(0.7)
(0.9)
(1.3)
(1.6)
(4.0)
(2.5)
3.0
(3.4)
(6.0)
Source: CSO, Angel Research
Source: MOSPI, Angel Research
Exhibit 3: Monthly CPI inflation trends
Exhibit 4: Manufacturing and services PMI
56.0
Mfg. PMI
Services PMI
(%)
55.0
7.0
5.7
5.8
5.8
6.1
54.0
6.0
5.4
5.6
5.5
5.0
5.3
5.1
53.0
4.8
5.0
4.4
52.0
4.0
51.0
50.0
3.0
49.0
2.0
48.0
1.0
47.0
-
46.0
Source: MOSPI, Angel Research
Source: Market, Angel Research; Note: Level above 50 indicates expansion
Exhibit 5: Exports and imports growth trends
Exhibit 6: Key policy rates
(%)
Exports yoy growth
Imports yoy growth
(%)
Repo rate
Reverse Repo rate
CRR
5.0
7.00
0.0
6.50
(5.0)
6.00
(10.0)
5.50
(15.0)
5.00
(20.0)
4.50
(25.0)
4.00
(30.0)
3.50
(35.0)
3.00
Source: Bloomberg, Angel Research
Source: RBI, Angel Research
Market Outlook
October 13, 2016
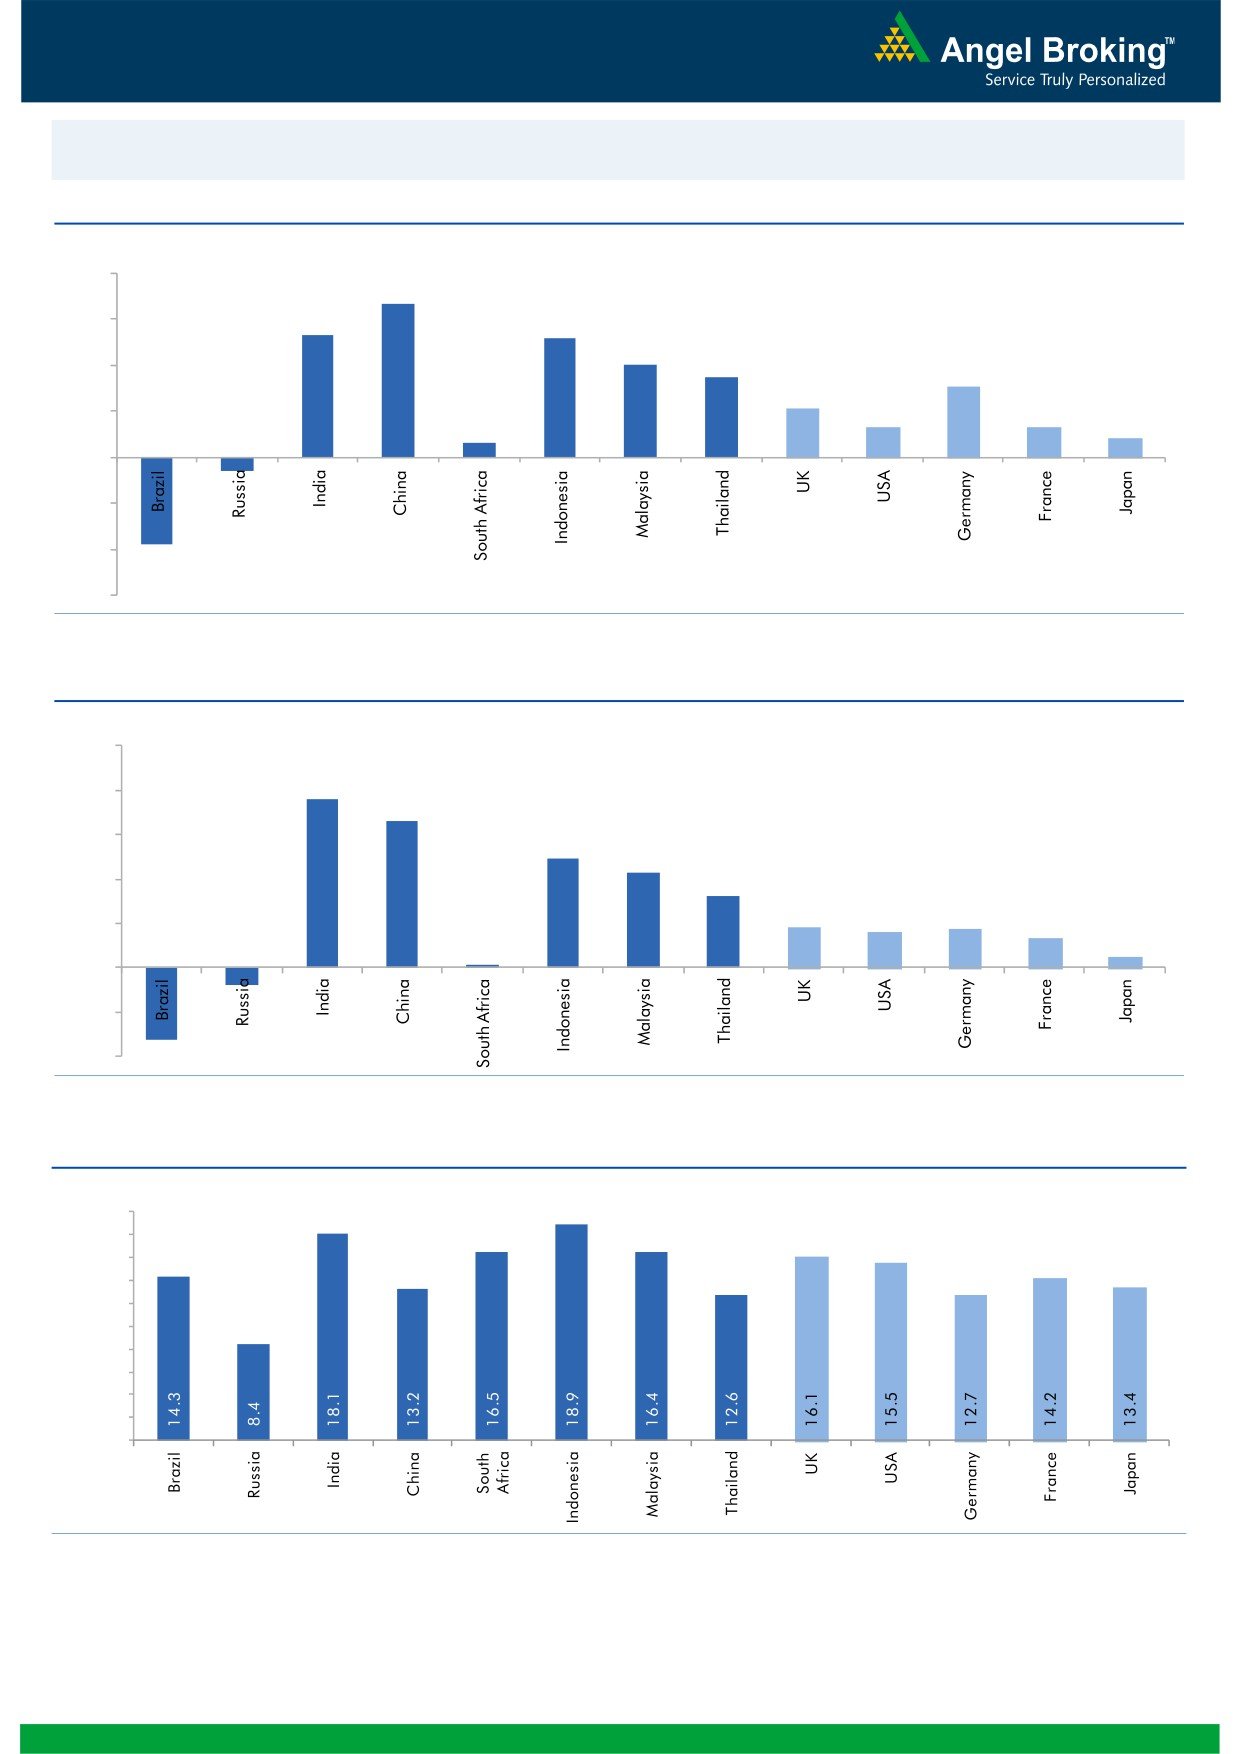
Global watch
Exhibit 1: Latest quarterly GDP Growth (%, yoy) across select developing and developed countries
(%)
8.0
6.7
6.0
5.3
0.6
5.2
4.0
3.5
4.0
3.1
2.1
2.0
1.3
1.3
0.8
-
(2.0)
(0.6)
(4.0)
(3.8)
(6.0)
Source: Bloomberg, Angel Research
Exhibit 2: 2016 GDP Growth projection by IMF (%, yoy) across select developing and developed countries
(%)
10.0
7.6
8.0
6.6
6.0
4.9
4.3
4.0
3.2
1.8
1.7
1.6
2.0
1.3
(0.8)
0.5
(3.3)
0.1
-
(2.0)
(4.0)
Source: IMF, Angel Research
Exhibit 3: One year forward P-E ratio across select developing and developed countries
(x)
20.0
18.0
16.0
14.0
12.0
10.0
8.0
6.0
4.0
2.0
-
Source: IMF, Angel Research
Market Outlook
October 13, 2016
Exhibit 4: Relative performance of indices across globe
Returns (%)
Country
Name of index
Closing price
1M
3M
1YR
Brazil
Bovespa
61,022
5.2
12.5
27.8
Russia
Micex
1,993
(1.3)
2.6
16.5
India
Nifty
8,709
(2.3)
4.4
9.5
China
Shanghai Composite
3,058
(0.3)
1.3
(1.4)
South Africa
Top 40
45,049
(2.7)
(2.2)
(4.6)
Mexico
Mexbol
47,915
3.1
3.6
8.7
Indonesia
LQ45
920
2.7
3.9
31.2
Malaysia
KLCI
1,667
(1.3)
1.4
2.3
Thailand
SET 50
896
(0.3)
(3.2)
3.4
USA
Dow Jones
18,144
(1.0)
(1.2)
7.2
UK
FTSE
7,024
4.8
5.3
10.8
Japan
Nikkei
16,840
(1.0)
10.2
(5.0)
Germany
DAX
10,523
(0.5)
6.0
4.6
France
CAC
4,452
0.3
1.5
(5.2)
Source: Bloomberg, Angel Research
Stock Watch
October 13, 2016
Company Name
Reco
CMP
Target
Mkt Cap
Sales ( Čcr )
OPM(%)
EPS (Č)
PER(x)
P/BV(x)
RoE(%)
EV/Sales(x)
(Č)
Price ( Č)
( Č cr )
FY17E FY18E
FY17E
FY18E
FY17E
FY18E
FY17E
FY18E
FY17E
FY18E
FY17E
FY18E
FY17E
FY18E
Agri / Agri Chemical
Rallis
Neutral
230
-
4,473
1,937
2,164
13.3
14.3
9.0
11.0
25.6
20.9
4.5
3.9
18.4
19.8
2.4
2.1
United Phosphorus
Neutral
673
-
34,095
15,176
17,604
18.5
18.5
37.4
44.6
18.0
15.1
3.5
2.9
21.4
21.2
2.4
2.0
Auto & Auto Ancillary
Ashok Leyland
Buy
81
111
22,966
22,407
26,022
10.6
10.6
5.2
6.4
15.5
12.6
3.5
3.0
23.6
24.7
1.1
0.9
Bajaj Auto
Neutral
2,875
-
83,189
25,093
27,891
19.5
19.2
143.9
162.5
20.0
17.7
5.6
4.8
30.3
29.4
3.1
2.7
Bharat Forge
Neutral
940
-
21,872
7,726
8,713
20.5
21.2
35.3
42.7
26.6
22.0
4.9
4.4
18.9
20.1
2.9
2.6
Eicher Motors
Neutral
25,800
-
70,076
16,583
20,447
17.5
18.0
598.0
745.2
43.1
34.6
14.7
11.2
41.2
38.3
4.1
3.2
Gabriel India
Neutral
121
-
1,741
1,544
1,715
9.0
9.3
5.4
6.3
22.4
19.2
4.2
3.8
18.9
19.5
1.1
0.9
Hero Motocorp
Neutral
3,490
-
69,685
31,253
35,198
15.3
15.0
172.3
192.1
20.3
18.2
7.4
6.4
38.9
37.0
2.1
1.8
Jamna Auto Industries Neutral
226
-
1,804
1,486
1,620
9.8
9.9
15.0
17.2
15.1
13.1
3.3
2.8
21.8
21.3
1.2
1.1
L G Balakrishnan & Bros Neutral
618
-
970
1,302
1,432
11.6
11.9
43.7
53.0
14.2
11.7
2.0
1.8
13.8
14.2
0.8
0.8
Mahindra and Mahindra Neutral
1,378
-
85,593
46,534
53,077
11.6
11.7
67.3
78.1
20.5
17.7
3.3
2.9
15.4
15.8
1.8
1.6
Maruti
Neutral
5,712
-
172,559
69,186
82,217
14.7
14.4
198.5
241.4
28.8
23.7
5.6
4.5
20.2
20.0
2.2
1.8
Minda Industries
Neutral
332
-
2,636
2,728
3,042
9.0
9.1
68.2
86.2
4.9
3.9
1.1
0.9
23.8
24.3
1.0
0.9
Motherson Sumi
Neutral
331
-
46,438
45,896
53,687
7.8
8.3
13.0
16.1
25.4
20.6
8.2
6.5
34.7
35.4
1.1
0.9
Rane Brake Lining
Neutral
1,279
-
1,013
511
562
11.3
11.5
28.1
30.9
45.5
41.4
7.0
6.3
15.3
15.0
2.1
1.9
Setco Automotive
Neutral
42
-
562
741
837
13.0
13.0
15.2
17.0
2.8
2.5
0.5
0.4
15.8
16.3
1.2
1.1
Tata Motors
Neutral
562
-
162,290
300,209
338,549
8.9
8.4
42.7
54.3
13.2
10.4
2.1
1.8
15.6
17.2
0.7
0.6
TVS Motor
Neutral
389
-
18,476
13,390
15,948
6.9
7.1
12.8
16.5
30.5
23.5
7.6
6.0
26.3
27.2
1.4
1.2
Amara Raja Batteries
Accumulate
1,053
1,174
17,993
5,429
6,471
17.5
17.6
35.3
43.5
29.8
24.2
6.8
5.6
25.3
24.8
3.2
2.6
Exide Industries
Neutral
193
-
16,405
7,439
8,307
15.0
15.0
8.1
9.3
23.8
20.8
3.3
3.0
14.3
16.7
1.8
1.6
Apollo Tyres
Neutral
224
-
11,384
12,877
14,504
14.3
13.9
21.4
23.0
10.4
9.7
1.6
1.4
16.4
15.2
1.1
1.0
Ceat
Neutral
1,367
-
5,529
7,524
8,624
13.0
12.7
131.1
144.3
10.4
9.5
1.9
1.6
19.8
18.6
0.8
0.7
JK Tyres
Neutral
152
-
3,440
7,455
8,056
15.0
15.0
21.8
24.5
7.0
6.2
1.5
1.2
22.8
21.3
0.6
0.5
Swaraj Engines
Neutral
1,326
-
1,647
660
810
15.2
16.4
54.5
72.8
24.3
18.2
7.6
6.9
31.5
39.2
2.3
1.9
Subros
Neutral
136
-
816
1,488
1,681
11.7
11.9
6.4
7.2
21.2
19.0
2.2
2.0
10.8
11.4
0.8
0.7
Indag Rubber
Neutral
209
-
550
286
326
19.8
16.8
11.7
13.3
17.9
15.7
3.0
2.8
17.8
17.1
1.7
1.5
Capital Goods
ACE
Neutral
45
-
448
709
814
4.1
4.6
1.4
2.1
32.4
21.6
1.3
1.3
4.4
6.0
0.8
0.7
BEML
Buy
907
1,157
3,778
3,451
4,055
6.3
9.2
31.4
57.9
28.9
15.7
1.7
1.6
6.3
10.9
1.2
1.0
Bharat Electronics
Accumulate
1,254
1,414
30,096
8,137
9,169
16.8
17.2
58.7
62.5
21.4
20.1
3.3
2.9
44.6
46.3
2.7
2.4
Stock Watch
October 13, 2016
Company Name
Reco
CMP
Target
Mkt Cap
Sales ( Čcr )
OPM(%)
EPS (Č)
PER(x)
P/BV(x)
RoE(%)
EV/Sales(x)
(Č)
Price ( Č)
( Č cr )
FY17E
FY18E
FY17E
FY18E
FY17E
FY18E
FY17E
FY18E
FY17E
FY18E
FY17E
FY18E
FY17E
FY18E
Capital Goods
Voltas
Neutral
389
-
12,870
6,511
7,514
7.9
8.7
12.9
16.3
30.2
23.9
5.4
4.8
16.7
18.5
1.7
1.5
BGR Energy
Neutral
117
-
845
16,567
33,848
6.0
5.6
7.8
5.9
15.0
19.8
0.9
0.8
4.7
4.2
0.2
0.1
BHEL
Neutral
135
-
33,079
28,797
34,742
-
2.8
2.3
6.9
58.8
19.6
1.0
1.0
1.3
4.8
0.8
0.6
Blue Star
Neutral
561
-
5,347
4,351
5,024
6.4
7.1
17.2
20.6
32.7
27.2
21.2
17.7
23.1
24.1
1.3
1.1
Crompton Greaves
Neutral
77
-
4,798
5,777
6,120
5.9
7.0
3.3
4.5
23.2
17.0
1.0
1.0
4.4
5.9
0.8
0.7
Greaves Cotton
Neutral
128
-
3,133
1,755
1,881
16.8
16.9
7.8
8.5
16.5
15.1
3.3
3.1
20.6
20.9
1.5
1.3
Inox Wind
Buy
225
286
5,002
5,605
6,267
15.7
16.4
24.8
30.0
9.1
7.5
2.5
1.9
25.9
24.4
0.9
0.7
KEC International
Neutral
125
-
3,217
9,294
10,186
7.9
8.1
9.9
11.9
12.6
10.5
1.9
1.6
15.6
16.3
0.6
0.5
Thermax
Neutral
873
-
10,399
5,421
5,940
7.3
7.3
25.7
30.2
34.0
28.9
4.1
3.8
12.2
13.1
1.8
1.7
VATech Wabag
Buy
565
681
3,082
3,136
3,845
8.9
9.1
26.0
35.9
21.8
15.8
2.7
2.3
13.4
15.9
0.9
0.7
Cement
ACC
Neutral
1,670
-
31,368
11,225
13,172
13.2
16.9
44.5
75.5
37.5
22.1
3.6
3.3
11.2
14.2
2.7
2.3
Ambuja Cements
Neutral
257
-
51,021
9,350
10,979
18.2
22.5
5.8
9.5
44.3
27.1
3.7
3.3
10.2
12.5
5.4
4.6
India Cements
Neutral
159
-
4,892
4,364
4,997
18.5
19.2
7.9
11.3
20.2
14.1
1.5
1.4
8.0
8.5
1.9
1.7
JK Cement
Neutral
970
-
6,779
4,398
5,173
15.5
17.5
31.2
55.5
31.1
17.5
3.7
3.2
12.0
15.5
2.1
1.7
J K Lakshmi Cement
Neutral
498
-
5,855
2,913
3,412
14.5
19.5
7.5
22.5
66.4
22.1
4.1
3.4
12.5
18.0
2.6
2.2
Orient Cement
Neutral
204
-
4,182
2,114
2,558
18.5
20.5
8.1
11.3
25.2
18.1
3.7
3.1
9.0
14.0
2.6
2.1
UltraTech Cement
Neutral
3,978
-
109,176
25,768
30,385
21.0
23.5
111.0
160.0
35.8
24.9
4.6
4.0
13.5
15.8
4.3
3.6
Construction
ITNL
Neutral
107
-
3,526
8,946
10,017
31.0
31.6
8.1
9.1
13.2
11.8
0.5
0.5
4.2
5.0
3.7
3.4
KNR Constructions
Neutral
793
-
2,230
1,385
1,673
14.7
14.0
41.2
48.5
19.2
16.4
3.6
3.1
14.9
15.2
1.7
1.4
Larsen & Toubro
Buy
1,451
1,700
135,253
67,665
77,249
10.7
11.5
57.3
71.2
25.3
20.4
2.3
2.2
12.6
14.3
2.2
1.9
Gujarat Pipavav Port
Neutral
183
-
8,849
705
788
52.2
51.7
5.0
5.6
36.6
32.7
3.6
3.2
11.2
11.2
12.5
10.7
Nagarjuna Const.
Neutral
86
-
4,778
8,842
9,775
9.1
8.8
5.3
6.4
16.2
13.4
1.3
1.2
8.2
9.1
0.7
0.6
PNC Infratech
Accumulate
127
143
3,253
2,350
2,904
13.1
13.2
9.0
8.8
14.1
14.4
0.5
0.5
15.9
13.9
1.5
1.2
Simplex Infra
Neutral
338
-
1,674
6,829
7,954
10.5
10.5
31.4
37.4
10.8
9.1
1.1
1.0
9.9
13.4
0.7
0.6
Power Mech Projects
Neutral
488
-
718
1,801
2,219
12.7
14.6
72.1
113.9
6.8
4.3
1.2
1.1
16.8
11.9
0.4
0.3
Sadbhav Engineering
Accumulate
280
298
4,802
3,598
4,140
10.3
10.6
9.0
11.9
31.1
23.5
3.3
2.9
9.9
11.9
1.6
1.4
NBCC
Neutral
262
-
15,711
7,428
9,549
7.9
8.6
8.2
11.0
31.9
23.8
1.6
1.3
28.2
28.7
1.8
1.4
MEP Infra
Neutral
43
-
699
1,877
1,943
30.6
29.8
3.0
4.2
14.3
10.2
6.9
4.7
0.6
0.6
1.7
1.6
SIPL
Neutral
107
-
3,774
1,036
1,252
65.5
66.2
(8.4)
(5.6)
4.0
4.6
(22.8)
(15.9)
11.8
9.9
Stock Watch
October 13, 2016
Company Name
Reco
CMP
Target
Mkt Cap
Sales ( Čcr )
OPM(%)
EPS (Č)
PER(x)
P/BV(x)
RoE(%)
EV/Sales(x)
(Č)
Price ( Č)
( Č cr )
FY17E
FY18E
FY17E
FY18E
FY17E
FY18E
FY17E
FY18E
FY17E
FY18E
FY17E
FY18E
FY17E
FY18E
Construction
Engineers India
Neutral
266
-
8,969
1,725
1,935
16.0
19.1
11.4
13.9
23.4
19.2
3.2
3.1
13.4
15.3
4.1
3.7
Financials
Axis Bank
Buy
531
630
126,832
46,932
53,575
3.5
3.4
32.4
44.6
16.4
11.9
2.1
1.8
13.6
16.5
-
-
Bank of Baroda
Neutral
162
-
37,327
19,980
23,178
1.8
1.8
11.5
17.3
14.1
9.4
1.6
1.3
8.3
10.1
-
-
Canara Bank
Neutral
325
-
17,647
15,225
16,836
1.8
1.8
14.5
28.0
22.4
11.6
1.6
1.3
5.8
8.5
-
-
Dewan Housing Finance Accumulate
293
325
8,538
2,225
2,688
2.9
2.9
29.7
34.6
9.9
8.5
1.6
1.4
16.1
16.8
-
-
Equitas Holdings
Buy
178
235
5,958
939
1,281
11.7
11.5
5.8
8.2
30.6
21.7
2.6
2.4
10.9
11.5
-
-
Federal Bank
Neutral
73
-
12,517
9,353
10,623
2.9
2.9
4.4
5.8
16.6
12.6
1.6
1.4
9.5
11.0
-
-
HDFC
Neutral
1,392
-
220,039
11,475
13,450
3.4
3.4
45.3
52.5
30.7
26.5
5.9
5.2
20.2
20.5
-
-
HDFC Bank
Accumulate
1,284
1,350
325,177
46,097
55,433
4.5
4.5
58.4
68.0
22.0
18.9
3.9
3.2
18.8
18.6
-
-
ICICI Bank
Neutral
250
-
145,481
39,029
45,903
3.3
3.3
16.7
16.3
15.0
15.3
1.9
1.7
10.1
12.4
-
-
LIC Housing Finance
Neutral
593
-
29,906
3,712
4,293
2.6
2.5
39.0
46.0
15.2
12.9
2.9
2.4
19.9
20.1
-
-
Punjab Natl.Bank
Neutral
144
-
30,728
23,532
23,595
2.3
2.4
6.8
12.6
21.2
11.5
3.3
2.3
3.3
6.5
-
-
RBL Bank
Accumulate
313
325
11,579
1,783
2,309
2.6
2.6
12.7
16.4
24.7
19.1
2.7
2.4
12.8
13.3
-
-
South Ind.Bank
Neutral
24
-
3,193
6,435
7,578
2.5
2.5
2.7
3.1
8.8
7.6
1.1
1.0
10.1
11.2
-
-
St Bk of India
Neutral
256
-
198,727
88,650
98,335
2.6
2.6
13.5
18.8
19.0
13.6
1.8
1.6
7.0
8.5
-
-
Union Bank
Neutral
146
-
10,030
13,450
14,925
2.3
2.3
25.5
34.5
5.7
4.2
0.8
0.7
7.5
10.2
-
-
Yes Bank
Neutral
1,279
-
53,865
8,978
11,281
3.3
3.4
74.0
90.0
17.3
14.2
3.3
2.8
17.0
17.2
-
-
FMCG
Asian Paints
Neutral
1,212
-
116,250
17,128
18,978
16.8
16.4
19.1
20.7
63.5
58.6
22.1
20.8
34.8
35.5
6.6
5.9
Britannia
Neutral
3,378
-
40,522
9,795
11,040
14.6
14.9
80.3
94.0
42.1
35.9
17.3
13.4
41.2
-
4.0
3.5
Colgate
Neutral
966
-
26,262
4,605
5,149
23.4
23.4
23.8
26.9
40.6
35.9
22.5
17.6
64.8
66.8
5.6
5.0
Dabur India
Neutral
286
-
50,232
8,315
9,405
19.8
20.7
8.1
9.2
35.3
31.0
9.8
8.1
31.6
31.0
5.7
5.0
GlaxoSmith Con*
Neutral
6,198
-
26,068
4,350
4,823
21.2
21.4
179.2
196.5
34.6
31.6
9.2
7.8
27.1
26.8
5.4
4.8
Godrej Consumer
Neutral
1,617
-
55,058
10,235
11,428
18.4
18.6
41.1
44.2
39.3
36.6
8.7
7.4
24.9
24.8
5.5
4.9
HUL
Neutral
876
-
189,599
35,252
38,495
17.6
17.4
20.4
21.9
42.9
40.0
35.3
30.9
82.2
77.3
5.2
4.8
ITC
Buy
240
283
289,881
40,059
44,439
39.0
39.2
9.1
10.1
26.4
23.8
7.2
6.3
27.2
26.5
6.7
6.0
Marico
Neutral
278
-
35,905
6,430
7,349
18.8
19.5
6.4
7.7
43.5
36.1
13.1
11.0
33.2
32.5
5.4
4.7
Nestle*
Neutral
6,631
-
63,933
10,073
11,807
20.7
21.5
124.8
154.2
53.1
43.0
21.8
19.6
34.8
36.7
6.2
5.3
Tata Global
Neutral
152
-
9,571
8,675
9,088
9.8
9.8
7.4
8.2
20.5
18.5
2.3
2.2
7.9
8.1
1.0
1.0
Procter & Gamble
Accumulate
7,050
7,369
22,885
2,939
3,342
23.2
23.0
146.2
163.7
48.2
43.1
108.0
103.5
25.3
23.5
7.3
6.3
Hygiene
Stock Watch
October 13, 2016
Company Name
Reco
CMP
Target
Mkt Cap
Sales ( Čcr )
OPM(%)
EPS (Č)
PER(x)
P/BV(x)
RoE(%)
EV/Sales(x)
(Č)
Price ( Č)
( Č cr )
FY17E FY18E
FY17E
FY18E
FY17E
FY18E
FY17E
FY18E
FY17E
FY18E
FY17E
FY18E
FY17E
FY18E
IT
HCL Tech^
Buy
813
1,000
114,709
49,242
57,168
20.5
20.5
55.7
64.1
14.6
12.7
3.0
2.3
20.3
17.9
2.2
1.8
Infosys
Buy
1,030
1,370
236,482
69,934
79,025
27.5
27.5
64.8
72.0
15.9
14.3
3.5
3.2
22.0
22.3
2.8
2.4
TCS
Buy
2,380
3,004
468,982
121,684
136,286
27.3
27.3
135.0
150.1
17.6
15.9
5.9
5.4
33.2
33.9
3.6
3.2
Tech Mahindra
Buy
422
700
40,934
30,347
33,685
17.0
17.0
37.5
41.3
11.2
10.2
2.5
2.1
21.8
20.7
1.1
0.9
Wipro
Buy
477
680
115,934
51,631
55,822
21.7
17.9
35.9
36.9
13.3
12.9
2.8
2.6
19.0
18.1
1.9
1.7
Media
D B Corp
Neutral
400
-
7,344
2,297
2,590
27.4
28.2
21.0
23.4
19.0
17.1
4.4
3.8
23.7
23.1
2.9
2.5
HT Media
Neutral
86
-
2,012
2,693
2,991
12.6
12.9
7.9
9.0
10.9
9.6
0.9
0.9
7.8
8.3
0.3
0.2
Jagran Prakashan
Accumulate
202
225
6,592
2,355
2,635
28.0
28.0
10.8
12.5
18.7
16.1
4.1
3.5
21.7
21.7
2.8
2.5
Sun TV Network
Neutral
557
-
21,949
2,850
3,265
70.1
71.0
26.2
30.4
21.3
18.3
5.4
4.8
24.3
25.6
7.4
6.3
Hindustan Media
Neutral
291
-
2,139
1,016
1,138
24.3
25.2
27.3
30.1
10.7
9.7
2.0
1.8
16.2
15.8
1.5
1.3
Ventures
TV Today Network
Accumulate
331
363
1,976
637
743
27.5
27.5
18.4
21.4
18.0
15.5
3.1
2.7
17.4
17.2
2.8
2.3
Metals & Mining
Coal India
Neutral
319
-
201,682
84,638
94,297
21.4
22.3
24.5
27.1
13.0
11.8
5.4
5.2
42.6
46.0
1.9
1.7
Hind. Zinc
Neutral
252
-
106,351
14,252
18,465
55.9
48.3
15.8
21.5
15.9
11.7
2.6
2.3
17.0
20.7
7.5
5.8
Hindalco
Neutral
161
-
33,174
107,899
112,095
7.4
8.2
9.2
13.0
17.5
12.4
0.8
0.8
4.8
6.6
0.8
0.8
JSW Steel
Neutral
1,813
-
43,833
53,201
58,779
16.1
16.2
130.6
153.7
13.9
11.8
1.9
1.6
14.0
14.4
1.6
1.4
NMDC
Neutral
119
-
47,041
6,643
7,284
44.4
47.7
7.1
7.7
16.7
15.4
1.5
1.4
8.8
9.2
4.8
4.3
SAIL
Neutral
51
-
20,857
47,528
53,738
(0.7)
2.1
(1.9)
2.6
19.4
0.6
0.5
(1.6)
3.9
1.3
1.2
Vedanta
Neutral
200
-
59,160
71,744
81,944
19.2
21.7
13.4
20.1
14.9
9.9
1.3
1.1
8.4
11.3
1.2
0.9
Tata Steel
Neutral
417
-
40,539
121,374
121,856
7.2
8.4
18.6
34.3
22.4
12.2
1.4
1.3
6.1
10.1
1.0
0.9
Oil & Gas
Cairn India
Neutral
227
-
42,634
9,127
10,632
4.3
20.6
8.8
11.7
25.8
19.4
0.8
0.8
3.3
4.2
6.0
5.0
GAIL
Neutral
419
-
53,098
56,220
65,198
9.3
10.1
27.1
33.3
15.5
12.6
1.4
1.3
9.3
10.7
1.1
0.9
ONGC
Neutral
268
-
228,859
137,222
152,563
15.0
21.8
19.5
24.1
13.7
11.1
1.2
1.1
8.5
10.1
2.0
1.7
Indian Oil Corp
Neutral
634
-
153,981
373,359
428,656
5.9
5.5
54.0
59.3
11.7
10.7
1.8
1.6
16.0
15.6
0.6
0.5
Reliance Industries
Neutral
1,096
-
355,356
301,963
358,039
12.1
12.6
87.7
101.7
12.5
10.8
1.3
1.2
10.7
11.3
1.7
1.4
Pharmaceuticals
Alembic Pharma
Neutral
672
-
12,666
3,483
4,083
20.2
21.4
24.3
30.4
27.7
22.1
6.3
5.0
25.5
25.3
3.6
3.0
Aurobindo Pharma
Neutral
856
-
50,073
15,720
18,078
23.7
23.7
41.4
47.3
20.7
18.1
5.4
4.2
29.6
26.1
3.4
3.0
Aventis*
Neutral
4,211
-
9,698
2,357
2,692
17.3
17.3
153.5
169.2
27.4
24.9
4.7
3.8
25.8
28.4
3.7
3.0
Cadila Healthcare
Neutral
389
-
39,813
11,126
13,148
22.0
22.0
17.1
20.0
22.7
19.5
5.8
4.6
28.8
26.6
3.6
2.9
Cipla
Reduce
581
490
46,651
15,378
18,089
17.4
18.4
21.6
27.2
26.9
21.3
3.5
3.0
13.7
15.2
3.2
2.7
Stock Watch
October 13, 2016
Company Name
Reco
CMP
Target
Mkt Cap
Sales ( Čcr )
OPM(%)
EPS (Č)
PER(x)
P/BV(x)
RoE(%)
EV/Sales(x)
(Č)
Price ( Č)
( Č cr )
FY17E FY18E
FY17E
FY18E
FY17E
FY18E
FY17E
FY18E
FY17E
FY18E
FY17E
FY18E
FY17E
FY18E
Pharmaceuticals
Dr Reddy's
Neutral
3,079
-
51,012
16,043
18,119
23.1
24.7
126.0
157.8
24.4
19.5
3.6
3.1
15.7
17.1
3.1
2.7
Dishman Pharma
Sell
248
45
4,005
1,718
1,890
22.7
22.8
9.5
11.3
26.1
22.0
2.5
2.3
10.1
10.9
2.7
2.4
GSK Pharma*
Neutral
2,924
-
24,768
3,528
3,811
16.6
18.8
51.8
59.4
56.5
49.2
15.1
15.0
26.3
30.6
6.8
6.3
Indoco Remedies
Sell
314
225
2,890
1,112
1,289
18.2
18.2
13.2
15.6
23.8
20.1
4.2
3.6
19.2
19.2
2.7
2.3
Ipca labs
Neutral
620
-
7,826
3,303
3,799
15.3
15.3
17.3
19.7
35.9
31.5
3.1
2.9
9.1
9.4
2.4
2.1
Lupin
Buy
1,516
1,809
68,359
15,912
18,644
26.4
26.7
58.1
69.3
26.1
21.9
5.1
4.2
21.4
20.9
4.3
3.6
Sun Pharma
Buy
754
944
181,549
31,129
35,258
30.0
30.9
28.0
32.8
26.9
23.0
4.1
3.4
18.7
18.9
5.4
4.6
Power
Tata Power
Neutral
81
-
21,867
36,916
39,557
17.4
27.1
5.1
6.3
15.9
12.8
1.4
1.3
9.0
10.3
1.6
1.4
NTPC
Neutral
146
-
120,755
86,605
95,545
17.5
20.8
11.8
13.4
12.4
10.9
1.3
1.2
10.5
11.1
2.8
2.8
Power Grid
Neutral
178
-
93,122
25,763
29,762
74.3
73.1
14.8
17.3
12.0
10.3
1.9
1.7
16.9
17.5
7.9
7.5
Real Estate
Prestige Estate
Neutral
203
-
7,614
4,707
5,105
25.2
26.0
10.3
13.0
19.7
15.6
1.6
1.5
10.3
10.2
2.8
2.5
MLIFE
Buy
440
522
1,807
1,152
1,300
22.7
24.6
29.9
35.8
14.7
12.3
1.1
1.0
7.6
8.6
2.3
1.9
Telecom
Bharti Airtel
Neutral
316
-
126,358
105,086
114,808
34.5
34.7
12.2
16.4
25.9
19.3
1.8
1.6
6.8
8.4
2.1
1.9
Idea Cellular
Neutral
80
-
28,716
40,133
43,731
37.2
37.1
6.4
6.5
12.5
12.3
1.0
1.0
8.2
7.6
1.7
1.5
zOthers
Abbott India
Neutral
4,751
-
10,095
3,153
3,583
14.1
14.4
152.2
182.7
31.2
26.0
153.3
130.9
25.6
26.1
2.9
2.5
Bajaj Electricals
Buy
261
306
2,640
5,099
5,805
5.6
5.9
11.4
14.6
23.0
17.9
3.1
2.7
13.4
15.1
0.5
0.5
Finolex Cables
Neutral
440
-
6,722
2,883
3,115
12.0
12.1
14.2
18.6
31.0
23.6
16.5
14.4
15.8
14.6
2.0
1.8
Goodyear India*
Neutral
866
-
1,997
1,598
1,704
10.4
10.2
49.4
52.6
17.5
16.5
80.9
71.0
18.2
17.0
0.9
128.6
Hitachi
Neutral
1,592
-
4,330
2,081
2,433
8.8
8.9
33.4
39.9
47.7
39.9
38.5
32.1
22.1
21.4
2.1
1.8
Jyothy Laboratories
Neutral
359
-
6,511
1,440
2,052
11.5
13.0
8.5
10.0
42.2
35.9
10.2
9.5
18.6
19.3
4.9
3.4
Page Industries
Neutral
15,662
-
17,469
2,450
3,124
20.1
17.6
299.0
310.0
52.4
50.5
348.8
266.3
47.1
87.5
7.1
5.6
Relaxo Footwears
Neutral
445
-
5,338
2,085
2,469
9.2
8.2
7.6
8.0
58.8
56.0
22.8
19.5
17.9
18.8
2.7
2.3
Siyaram Silk Mills
Neutral
1,538
-
1,442
1,799
2,040
11.6
11.7
104.9
122.4
14.7
12.6
2.4
2.1
16.4
16.4
1.0
0.9
Styrolution ABS India*
Neutral
624
-
1,098
1,440
1,537
9.2
9.0
40.6
42.6
15.4
14.7
39.3
35.7
12.3
11.6
0.7
0.6
TVS Srichakra
Neutral
3,838
-
2,939
2,304
2,614
13.7
13.8
231.1
266.6
16.6
14.4
431.2
339.5
33.9
29.3
1.3
1.1
HSIL
Neutral
344
-
2,487
2,384
2,515
15.8
16.3
15.3
19.4
22.5
17.7
22.3
19.2
7.8
9.3
1.2
1.1
Kirloskar Engines India
Neutral
357
-
5,159
2,554
2,800
9.9
10.0
10.5
12.1
34.0
29.5
14.2
13.4
10.7
11.7
1.7
1.5
Ltd
M M Forgings
Neutral
453
-
547
546
608
20.4
20.7
41.3
48.7
11.0
9.3
62.1
54.9
16.6
17.0
0.9
0.8
Banco Products (India)
Neutral
223
-
1,598
1,353
1,471
12.3
12.4
14.5
16.3
15.4
13.7
21.3
19.2
14.5
14.6
1.1
115.8
Stock Watch
October 13, 2016
Company Name
Reco
CMP
Target
Mkt Cap
Sales ( Čcr )
OPM(%)
EPS (Č)
PER(x)
P/BV(x)
RoE(%)
EV/Sales(x)
(Č)
Price ( Č)
( Č cr )
FY17E
FY18E
FY17E
FY18E
FY17E
FY18E
FY17E
FY18E
FY17E
FY18E
FY17E
FY18E
FY17E
FY18E
zOthers
Competent Automobiles Neutral
192
-
118
1,137
1,256
3.1
2.7
28.0
23.6
6.9
8.2
37.0
33.4
14.3
11.5
0.1
0.1
Nilkamal
Neutral
1,344
-
2,005
1,995
2,165
10.7
10.4
69.8
80.6
19.3
16.7
76.8
66.7
16.6
16.5
1.0
0.9
Visaka Industries
Neutral
192
-
305
1,051
1,138
10.3
10.4
21.0
23.1
9.1
8.3
24.6
23.1
9.0
9.2
0.6
0.5
Transport Corporation of
Neutral
183
-
1,401
2,671
2,911
8.5
8.8
13.9
15.7
13.2
11.7
1.8
1.6
13.7
13.8
0.6
0.6
India
Elecon Engineering
Neutral
65
-
704
1,482
1,660
13.7
14.5
3.9
5.8
16.6
11.2
3.9
3.6
7.8
10.9
0.8
0.7
Surya Roshni
Neutral
224
-
982
3,342
3,625
7.8
7.5
17.3
19.8
13.0
11.3
24.6
19.8
10.5
10.8
0.6
0.5
MT Educare
Neutral
140
-
557
366
417
17.7
18.2
9.4
10.8
14.9
12.9
3.3
2.9
22.2
22.3
1.5
1.3
Radico Khaitan
Neutral
144
-
1,916
1,659
1,802
13.0
13.2
6.3
7.4
22.7
19.5
2.0
1.8
8.6
9.3
1.5
1.4
Garware Wall Ropes
Neutral
537
-
1,174
873
938
12.9
13.1
30.9
34.9
17.4
15.4
2.7
2.3
15.7
15.2
1.3
1.2
Wonderla Holidays
Neutral
400
-
2,257
287
355
38.0
40.0
11.3
14.2
35.4
28.1
5.1
4.4
21.4
23.9
7.5
6.1
Linc Pen & Plastics
Neutral
263
-
388
382
420
9.3
9.5
13.5
15.7
19.5
16.7
3.3
2.9
17.1
17.3
1.1
1.0
The Byke Hospitality
Neutral
186
-
747
287
384
20.5
20.5
7.6
10.7
24.5
17.4
5.1
4.1
20.7
23.5
2.6
2.0
Interglobe Aviation
Neutral
937
-
33,756
21,122
26,005
14.5
27.6
110.7
132.1
8.5
7.1
50.6
36.2
168.5
201.1
1.6
1.2
Coffee Day Enterprises
Neutral
225
-
4,641
2,964
3,260
20.5
21.2
4.7
8.0
-
28.2
2.6
2.4
5.5
8.5
2.0
1.8
Ltd
Navneet Education
Neutral
102
-
2,421
1,062
1,147
24.0
24.0
6.1
6.6
16.7
15.3
3.4
3.0
20.6
19.8
2.3
2.2
Navkar Corporation
Buy
194
265
2,770
408
612
42.9
42.3
6.8
11.5
28.7
16.9
2.0
1.8
6.9
10.5
7.7
5.2
UFO Moviez
Neutral
477
-
1,317
619
685
33.2
33.4
30.0
34.9
15.9
13.7
2.2
1.9
13.8
13.9
1.8
1.4
VRL Logistics
Neutral
315
-
2,874
1,902
2,119
16.7
16.6
14.6
16.8
21.6
18.7
4.7
4.2
21.9
22.2
1.6
1.4
Team Lease Serv.
Neutral
1,052
-
1,799
3,229
4,001
1.5
1.8
22.8
32.8
46.2
32.0
5.0
4.3
10.7
13.4
0.5
0.4
S H Kelkar & Co.
Neutral
304
-
4,394
1,036
1,160
15.1
15.0
6.1
7.2
49.8
42.3
5.3
4.9
10.7
11.5
4.0
3.5
Quick Heal
Neutral
234
-
1,640
408
495
27.3
27.0
7.7
8.8
30.3
26.6
2.8
2.8
9.3
10.6
3.2
2.7
Narayana Hrudaya
Neutral
336
-
6,859
1,873
2,166
11.5
11.7
2.6
4.0
126.9
84.7
7.8
7.0
6.1
8.3
3.8
3.2
Manpasand Bever.
Neutral
717
-
4,098
836
1,087
19.6
19.4
16.9
23.8
42.4
30.1
5.1
4.4
12.0
14.8
4.1
3.1
Parag Milk Foods
Neutral
304
-
2,560
1,919
2,231
9.3
9.6
9.5
12.9
32.2
23.5
5.0
4.1
15.5
17.5
1.5
1.3
Mirza International
Buy
96
113
1,150
1,024
1,148
18.0
18.0
6.9
8.0
13.9
11.9
2.3
2.0
16.6
16.2
1.3
1.2
Source: Company, Angel Research; Note: *December year end; #September year end; &October year end; Price as on October 10, 2016
Market Outlook
October 13, 2016
Research Team Tel: 022 - 39357800
DISCLAIMER
Angel Broking Private Limited (hereinafter referred to as “Angel”) is a registered Member of National Stock Exchange of India
Limited,Bombay Stock Exchange Limited and Metropolitan Stock Exchange Limited. It is also registered as a Depository Participant with
CDSL and Portfolio Manager with SEBI. It also has registration with AMFI as a Mutual Fund Distributor. Angel Broking Private Limited is a
registered entity with SEBI for Research Analyst in terms of SEBI (Research Analyst) Regulations, 2014 vide registration number
INH000000164. Angel or its associates has not been debarred/ suspended by SEBI or any other regulatory authority for accessing
/dealing in securities Market. Angel or its associates/analyst has not received any compensation / managed or
co-managed public offering of securities of the company covered by Analyst during the past twelve months.
This document is solely for the personal information of the recipient, and must not be singularly used as the basis of any investment
decision. Nothing in this document should be construed as investment or financial advice. Each recipient of this document should make
such investigations as they deem necessary to arrive at an independent evaluation of an investment in the securities of the companies
referred to in this document (including the merits and risks involved), and should consult their own advisors to determine the merits and
risks of such an investment.
Reports based on technical and derivative analysis center on studying charts of a stock's price movement, outstanding positions and
trading volume, as opposed to focusing on a company's fundamentals and, as such, may not match with a report on a company's
fundamentals. Investors are advised to refer the Fundamental and Technical Research Reports available on our website to evaluate the
contrary view, if any.
The information in this document has been printed on the basis of publicly available information, internal data and other reliable
sources believed to be true, but we do not represent that it is accurate or complete and it should not be relied on as such, as this
document is for general guidance only. Angel Broking Pvt. Limited or any of its affiliates/ group companies shall not be in any way
responsible for any loss or damage that may arise to any person from any inadvertent error in the information contained in this report.
Angel Broking Pvt. Limited has not independently verified all the information contained within this document. Accordingly, we cannot
testify, nor make any representation or warranty, express or implied, to the accuracy, contents or data contained within this document.
While Angel Broking Pvt. Limited endeavors to update on a reasonable basis the information discussed in this material, there may be
regulatory, compliance, or other reasons that prevent us from doing so.
This document is being supplied to you solely for your information, and its contents, information or data may not be reproduced,
redistributed or passed on, directly or indirectly.
Neither Angel Broking Pvt. Limited, nor its directors, employees or affiliates shall be liable for any loss or damage that may arise from
or in connection with the use of this information.